This lesson presents background on radio waves, signal
modulation, and the use of radio as a data communication medium.
Objectives important to this lesson:
Principles of radio transmission
Analog and digital modulation
Units of measurement
Radio wave behaviors and effects on communications
Concepts:
Chapter 3
The chapter begins with a story about high tech sailboat
racing that seems to have little to do with the chapter topics. It then
starts a discussion about troubleshooting, A page and a half into the
chapter, we are finally told that troubleshooting skills should be
based on an understanding of the technology being used. Buried the lead
a bit, didn't he?
Let's get to the point, that you should understand some basic theory
about radio waves before we go farther into wireless networking. On page
82, our author begins a lesson in physics about waves. It is a pretty
good lesson. He begins with a mental image of a campfire that is producing
heat, light, and the sound of a crackling fire. Most people have probably
experienced something like this, so it is a good place to start.
The author explains that the sound of the fire (or any sound,
for that matter) is caused by vibrations which disturb the air around
the thing that is vibrating. Those vibrations travel to our ears as
waves of pressure that cause our eardrums to vibrate, which causes us
to perceive the sound. The critical feature for this discussion is the
series of pressure waves that we sense as sound. The author tells us
that the light and heat of a fire create waves, but of a different
kind. These are not pressure waves. They are electromagnetic waves that
do not require air to travel to us. Visible light is the most common
electromagnetic wave most of us encounter. The author explains that an
electromagnetic wave actually has an electrical component, and a
magnetic component, which he illustrates on page 82 as two pulsing
waves that are linked, but which are traveling on the same path,
rotated 90 degrees from each other.
The image above is similar to the one in the text. I have linked it to
the web site where I found it, which also discusses electromagnetic waves.
The author points out that waves of this sort are continuous:
they have a beginning, but they do not stop at any given point in their
journey. (They do eventually fade to nothing, but that's not the same
as stopping and starting again.)
They travel in a pulsing cycle
that is usually depicted on a graph as:
going from 0 to a positive peak,
from the positive peak back to 0,
from 0 to a negative peak (as far from 0 as the positive
peak),
and then back to 0, over and over.
This pattern is called a sine wave,
after the trigonometry function it resembles. The image above shows us
that the waves have a wavelength,
the distance a wave travels in one complete cycle.
Let me pull in a few notes from another
class to illustrate some concepts:
amplitude-
The strength of a signal; amplitude is easily understood by turning
a volume control up and down on any media player: greater amplitude
means louder (stronger signal), lesser amplitude means quieter/softer
(weaker signal). In the illustration above, the range of the amplitude
is the distance from 0 to the positive peak, or 0 to the negative peak.
frequency-
When we talk about network signals, we typically talk about electrical
signals on copper wire, light signals on fiber optic cable, and radio
signals to Wireless Access Points or cell towers. Basicphysicsfor
electricity and electromagnetic waves (including light and radio):frequencytimeswavelengthequals
thespeed
of light. (Which makes me wonder what the author was thinking
earlier in the book when he said that infrared waves move slower than
other waves.) The whole story is a bit more complicated. The speed of
light that the text mentions (rounded off to 186,000 miles per second
or 300,000 kilometers per second) is actually the speed of light in
a vacuum. The actual speed
of an electromagnetic wave varies with the medium through which
it is passing: air, water, copper, fiber, and other materials each have
a slightly different value for the speed of light.
Thisonline
oscilloscopeallows
us to see what happens when we change frequency (how many wave cycles
occur per second) and amplitude (strength of the signal). Change the
frequency with the Frequency slider, change the amplitude with the Gain
slider.
This
oscilloscopeallows
us to change amplitude, frequency, and wavelength of a signal. Notice
thatincreasingfrequencydecreaseswavelength,
and vice versa, because they are inversely proportional.
The text tells us the frequency is measured in hertz. It is named for
Heinrich
Rudolph Hertz, the researcher who proved electromagnetic waves exist.
One hertz is one cycle per second. Metric prefixes are used to express
large numbers of hertz:
Hertz - Hz - 1 cycle per second
Kilohertz - KHz - 1 thousand cycles per second
Megahertz - MHz - 1 million cycles per second
Gigahertz - GHz - 1 billion cycles per second
phase-
Phase is harder to understand until you see a representation of a wave,
like the sine waves shown in the examples so far.
Let's look at another online oscilloscope to get a better idea of the
concept.Returning
to the last oscilloscope, we
can change from a sine wave
to a cosine wave, which is like
what happens when we change the phaseof
the wave, causing the part that is generated next to be different from
what is expected. Four phases of a sine wave are:risingfrom0
to positivepeak,fallingfrompositive
peak to zero,fallingfromzero
to negative peak, andrisingfromnegative
peak to zero. A cosine wavehas
the same parts, but acosinewave
begins at thetopof
a positive peak, and asinewave
begins atzerorising
to the positive peak.
As
an aside, I could teach you about trigonometry here, but that might be
a bit much. Let's use what the book tells us in a different form:
0 degrees
90 degrees
180 degrees
270 degrees
sine wave
0
1
0
-1
cosine wave
1
0
-1
0
Looking
at the values above, you should be able to imagine that the cycles of
a sine wave and a cosine wave areoffsetby
one quarter of a cycle. This is why shifting from one to the other is
an effective way to simulate changing the phase of the wave. In the terminology
used in the text, the two waves described above are 90 degrees out
of phase, one quarter of a cycle.
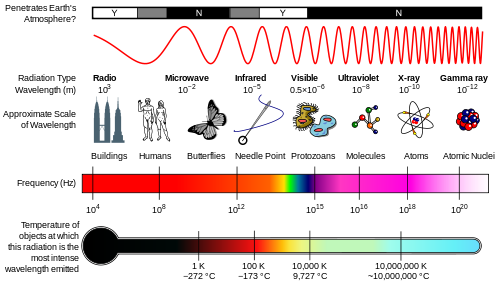
The text moves on to inform us that the electromagnetic energy
we have been considering could be any
form of radio wave, microwave, infrared wave, visible light wave,
ultraviolet wave, x-ray, gamma ray, or any other example of such
radiated energy. If you examine the diagram on page 88, you will see
that I just named several different kinds of electromagnetic radiation
that are all in the same family.
You could say they are all different kinds of light, but you could just as well
say they are all different kinds of waves.
The only difference, really is in the frequency
and wavelength that defines
each one. The text gives us the impression that the spectrum has a
beginning and an end, but it really does not. This version of similar
information from Wikipedia names a few more categories.
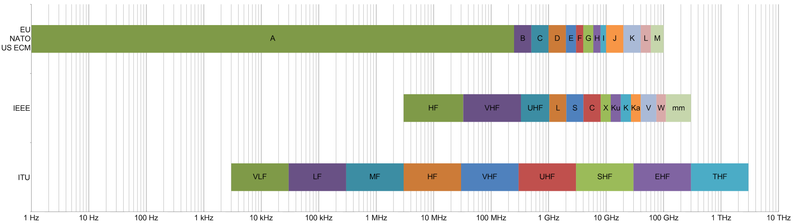
The text also presents us with a list of frequency ranges on
page 90 that it calls bands. These particular bands are all
contiguous. Several more bands are listed on this page in
Wikipedia. (It is a bit large to reproduce here.) Note that the
ITU, the IEEE, and governmental agencies all have their own band
designations. The image below summarizes some of these. More detail is
available at the page I just mentioned. When you refer to a band, you
may need to know the right system to use for your audience to
understand what you mean.
A standard topic for a discussion of this kind is
wave modulation. To send data over a wave, we need to modify
(modulate) that wave by some system that gives meaning to the
changes we make to it. The changes will represent 1s, 0s, or some
pattern of 1s and 0s. That makes it a carrier wave, carrier
signal, or just a carrier. (They all mean the same thing.)
The text discusses modulation of analog and digital waves. We should understand
both of those words, since we have already talked about modulation.
analog - Analog events have
an infinite number of values
within an operational range. Think of a hose connected to a water faucet.
We can turn the hose on full force,
or turn it off, but we can also
turn it to any imaginable value
between those two states. A dimmer switch on a dining room light is
like that, too. It can be turned to its brightest
setting, it can be turned off,
or it can be turned to any setting
in between. Sound waves are like that. Human ears can often hear
a sound wave if it has any value between 20
Hz and 20 KHz, including
fractional values. This is why some people who love recorded music prefer
to listen to it in an analog format, which can reproduce every variation
made by the original musicians.
digital - Digital events have
defined states, like on and
off, and they cannot be in any
state in between. Digital waves are like that. They are often shown
as square waves that have peaks and troughs, but have only abrupt, instant
transitions between the two states.
Digital and analog waves can both be modulated.
Three kinds of modulation are described that apply to both kinds of
waves. They are the three methods described above. There is a
difference between analog terms and digital terms. When we modulate
digital signals, we call it keying:
amplitude shift keying
frequency shift keying
phase shift keying
The text moves on to discuss five methods that
are used to measure radio frequency (RF) signals.
milliwatt (mW)
- The author tries to help us understand electrical pressure (voltage)
by comparing it to water pressure in a pipe. I find his method to be
distracting. Let's try it like this.
The power of a wireless signal is created in an electrical circuit
that uses wires, so standard electrical theory applies at the point
of origin.
The basic power level in
the circuit is measured in volts.
The symbol for it is V.
The amount of of power flowing
through a circuit is measured in amperes
(amps). It is also called
current. The symbol for it
is I. (That is a capital i
which stands for intensity.)
The wires in any circuit resist
the flow of electrons to some degree. This resistance is measured
in ohms. The symbol for it
is R (for resistance).
Voltage = Current
times Resistance (V
= I x R)
The power flowing through a circuit is also measured in watts.
The symbol for watts is often P.
Watts = Voltage
times Current, so P
= V x I = I
x R x I
There are a thousand milliwatts
in a watt. Either unit can
be used to measure power in a circuit.
decibel milliwatt (dBm)
- This section of the text is rather confusing. It requires that you
understand something that the author has not really explained. We have
just discussed milliwatts, but what are decibels?
A decibel is a tenth of a Bel, which is a unit that was used to measure
power in telephone systems. (Guess who it was named for.) A decibel
is not a real unit, like a volt or a watt. It is a way of comparing
two things, like the signal strength of a transmission and the noise
that is interfering with it. The video
below explains that it is "a logarithmic expression of the ratio
of two power levels". The lecturer says we multiply 10 times the log
of the ratio of two power levels. So, what is a log? Well, a logarithm,
in general, is the exponent that some base number has
to be raised to, in order to get another number.
In the case of decibels,
the base number for our logarithms is 10. So, let's assume
we have two power levels that we can call P1 and P2.
If P1 is twice the value of P2, the ratio P1/P2 gives us 2.
We can feed that to a calculator that understands log 10,
which means log to the base 10, and we get .30102999. That is
the exponent we have to raise 10 to, in order to get 2.
We then multiply by 10 according to our presenter, which gives
us about 3 decibels. Why did we multiply by 10? Because we want
to round off to an integer, not a fraction. (The calculator in Windows
will not calculate a log, but Google will.) The presenter gives us a
chart of several values:
P1
P2
P1/P2
dB
1
1
1
0
2
1
2
3
10
1
10
10
0.5
1
0.5
-3
100
1
100
20
1000
1
1000
30
You can see that a ratio greater than 1 will give us some positive dB,
and a ratio less than 1 (some fraction) gives us a negative dB. You
will also see that larger and larger ratios give us give us larger and
larger dB values, but the increases are not linear, which is
what an exponential scale is all about. Huge values will be expressed
as numbers that fit on a scale that humans can perceive.
So, what is a dBm? It is a ratio of two power values, converted to a
logarithm, with reference to to a milliwatt. After confusing us for
a couple of pages, our author mentions something that agrees with the
table in the video.
A loss of 3 dB is about the same as a ratio of 1 to 2.
A gain of 3 dB is about the same as a ratio of 2 to 1.
A loss of 10 dB is about the same as a ratio of 1 to 10.
A gain of 10 dB is about the same as a ratio of 10 to 1.
The text calls these facts the rules of 10s and 3s in RF math.
The third measure relates specifically to a wireless signal.
A Receive Signal Strength Indicator (RSSI) is a measure
that is taken by a wireless NIC to determine if it is in range of a
wireless signal. The IEEE tells us this measure is not absolute
because it is implemented differently by various NIC manufacturers.
The value used for the top end of the scale varies from one vendor to
another. Nice to know about it, but not much value in that one. See
the next bullet for a better option.
Percentage - a refinement on the use of RSSI is to show the
current RSSI signal strength as a percentage rather than as an integer.
This makes the values more comparable from one maker to another.
Signal to Noise Ratio - Signal and Noise are both measured
in decibels, which means that they are both logarithmic values. Why
do we care? We care because when we divide
an exponential quantity by another exponential quantity, we don't
divide, we subtract. The text defines noise as "unwanted
signal components". Where does it come from? Some noise is caused by
background noise, signal elements generated by the
equipment itself. It can also be caused by radio frequency interference
(RFI) which can be caused by the medium picking up
actual radio signals or radio frequency emissions from any equipment
that makes them. The text discusses a major source of noise, electromagnetic
interference (EMI) which can come from generators,
power lines, electric devices, and from other communication lines.
In addition to noise being added to the line, the signal
itself tends to fade out as it travels over the line.
The general phenomenon is called attenuation, which
is explained as fading over distance. Electricity-based signals can
fade due to the resistance (impedance) of the wire
being used. The signals can also be distorted, as discussed
in a few pages, to the point where we can no longer use the signal.
We typically measure the power/strength of a signal and the power/strength
of the noise on a line in decibels (dB), which, as you now know, are
measured on a logarithmic scale. Logarithms are exponents, so when we
calculate the ratio of signal to noise we actually subtract the noise
decibel rating from the signal decibel rating.
Algebra review:
x3 * x2 = x(3+2) <-- x to the third
power times x to the second power is the same as x to
the (3 plus 2) power
x3 / x2 = x(3-2) <-- x to the third
power divided by x to the second power is the same as
x to the (3 minus 2) power
The decibel rating is an exponent of a base level, so
where we would normally divide, we subtract the exponent of the noise
from the exponent of the signal, giving us the relative signal strength.
Example:
We can count on noise increasing over distance.
Suppose a signal is generated at 80 dB.
It attenuates (fades) by 10 dB per kilometer.
If there were no other factors, the signal would fade to nothing
within 8 kilometers.
However, we are told that there is a noise level of 20
dB on the line from the start, lowering the effective signal
to noise ratio to 60 at the point
of signal generation. This would move the effective length of
the medium to 6 kilometers.
There is more. The noise on the medium increases
by 5 dB per kilometer.
The signal fades over distance, and noise increases. In this case, the
signal is useless at 4 kilometers. Even though the signal
strength is still 40%, the noise strength matches it
at that point. The maximum operational length for the medium could be
shorter yet if the receiver needed the signal to noise ratio to be
something more than just "greater than zero".
The last major topic in the chapter is about
things that go wrong with radio frequency signals. The text discusses
several problems that complicate sending and receiving wireless
signals. It refers to them as propagation behaviors, which
happen because waves are typically sent out in all directions and they
encounter several kinds of hazards.
absorption - radio
signals can be absorbed by some materials, such as concrete, wood, and
asphalt
reflection - most
metal surfaces can reflect a signal in another direction; so can large
smooth walls and buildings
scattering - small
objects and objects with rough surfaces, sand, foliage, and rocks can
all cause a signal to be sent in multiple directions
refraction -
signals can be bent in new directions by storms or by layers of air
with different temperatures and densities
diffraction - a
signal can be bent around the surface of an object, often becoming
distorted by the process
Each of these behaviors can lead to undesired results:
signal loss, which
can occur in two ways
Free Space Path Loss
(FSPL) - This is the result of
natural attenuation, the fading of any signal over distance.
Delay Spread -
This is what the previous section of the chapter was talking about when
it told us that we are likely to receive multiple copies of any signal due to
the causes listed above, some of which will be damaged. They will be received at different times, due to the longer
path some will take to reach our receiver. Delay spread is the time
range across which we receive those signals. The text lists three
effects of delay spread:
downfade - when
one of the signal copies arrives out of phase with another, the two
signals interact, causing a decrease in amplitude (signal strength)
corruption - if
the downfade decreases amplitude so much that the signal cannot be
understood, that signal is corrupted
nulling - when
two signals arrive that are exactly 180
degrees out of phase, they cancel
each other
amplification -
when two signals arrive in phase
or almost in phase, they can be combined
as one signal at a higher
signal strength